
Perspective
Planning and place
12 minute read
When a housing target is larger than delivery
Need is a number. Delivery is a chain.
By David Doyle, Principal, DDA
David Doyle is the principal of DDA, a Metro Vancouver practice that builds primary evidence bases for policy development, strategic planning, and public-sector submissions.
A housing target can be fully defensible and still tell a council very little about whether anyone will build the housing. Need and delivery are different questions.
A needs assessment can find that a community requires 291 additional units over twenty years. The calculation can be careful, the demographic assumptions reasonable, and the shortage real. None of that shows that the community can produce 291 units.
Housing appears only after a sequence of conditions is in place. Households form, and suitable land is available. Policy permits the intended form, and infrastructure can serve it. The project works economically, and finance is available. Builders are willing and able to construct it, the municipality gives approvals, and the completed units find occupants at a price the intended market can pay.
A target sits at one end of that chain, and delivery sits at the other. The analytical problem starts when people treat the number at the first end as proof that the mechanism between the two ends already exists.
A target makes the problem visible
Housing targets are useful because they compress a complex problem into a number that councils can discuss, compare, budget for, and put into policy. That simplification is necessary. It becomes dangerous when the simplification becomes the plan.
In Fruitvale, a village of about 2,000 people in the West Kootenay, the RDKB Interim Housing Needs Report sets a need of 291 units over twenty years. At an even rate, that is about 14.5 units a year. From 2009 to 2019, the Village built 36 units, or 3.6 a year, according to its 2024 land disposition RFP. An earlier count points the same way: a 2020 background report for the Village recorded 21 new homes from 2014 to 2018, plus 3 mobile homes. The target needs a production rate about four times the historical rate. The five-year need in the same report is 107 units, or about 21 a year, which is nearly six times the built rate. Of the 36 units built, 41 percent were mobile homes and 56 percent were single-detached homes, so the built rate describes a narrow range of housing forms.
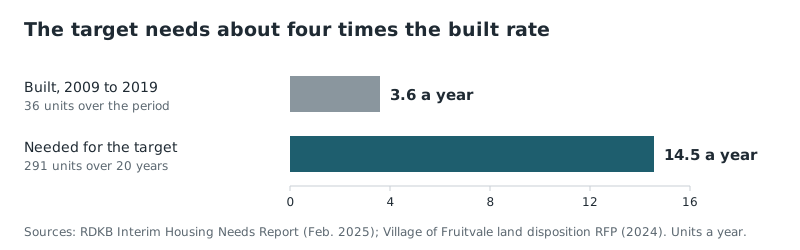
That comparison does not prove the target is too high. It raises a question the target cannot answer: what changes in the delivery system will let a community that built 3.6 units a year build something closer to 14.5?
There can be a good answer. New land can become available, or servicing can expand. Zoning can change in a material way. A public or non-profit developer can enter the market, or a large project can already have finance. Demand can shift enough to support forms that did not work financially before.
One of those mechanisms, or something similar, must exist. Without a change in mechanism, the target describes a future that people want, and the historical rate describes the system that produces the present. The gap between them is too large to be a rounding error. It is the problem the plan must explain.
Local builders named a broken link
The record has a second piece of evidence. In 2020, CitySpaces Consulting prepared a background report for the Village that recorded what local realtors and builders said about the market. The gap in ownership supply was newer homes at $300,000 to $320,000. Local builders had not been able to deliver new single-detached or duplex homes at that price, and they named infrastructure costs and development charges as the barriers.
This evidence needs careful reading. It is a statement from the people who build in that market, recorded through interviews. It is also six years old, and construction costs have risen since. It does not show that housing is impossible in the community, and it does not set one cost per unit for every tenure, form, site, or delivery model.
What it gives is more specific. Local builders said they cannot produce a defined product at a defined price, and they named the cost items that cause the gap.
That must change the analysis. If a housing strategy assumes builders will deliver new units at a price local builders said they cannot meet, the strategy contains a contradiction. Something must change: the proposed form, the cost assumption, the funding structure, the land or servicing contribution, or the procurement model. The alternative is new evidence that shows the 2020 statement no longer applies.
Another repetition of the target does not resolve the contradiction, and neither does another policy statement. The evidence identifies a link in the delivery chain, and the plan must explain it.
Read the figures as one system
The same 2020 report shows that the vacancy rate in the Trail, Warfield, and Fruitvale area fell from 12 percent to 3 percent between 2015 and 2017. The report itself notes that 3 percent is often called a balanced rate. The signal is the direction and speed of the change.
The first task is to identify what kind of evidence each number is. The vacancy figure is a signal of market tightness for one geography and one period. The 291-unit estimate is a projection of housing need. The 3.6-unit rate is a record of historical production. The builders' statement is an account, from the people who build, of what one product costs to deliver. These four numbers measure different things, and they become useful when you put them in one causal sequence.
The drop in vacancy shows a market that tightened quickly. A needs model estimates how many additional units the community requires. Completions show how the production system actually performed. The builders' statement shows where one delivery mechanism failed at the costs of the time. Read separately, the numbers fill a report. Read together, they start to diagnose a system.
The question changes from "How much housing do we need?" to a more useful one: where does the conversion of need into completed housing break?
Housing delivery is a chain-link problem
Housing production has one important property: success at one stage cannot fully compensate for failure at another.
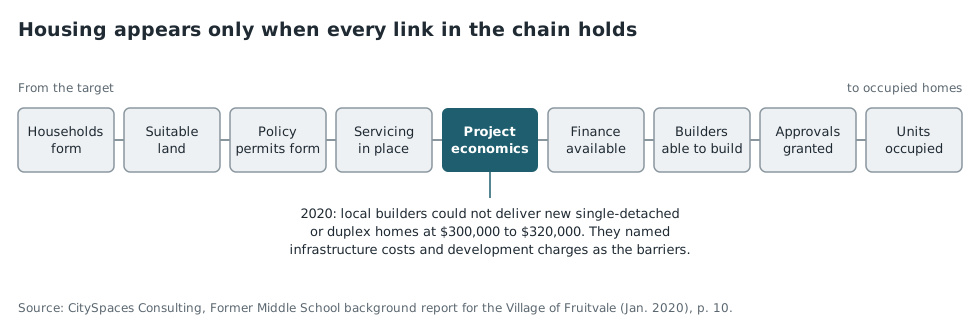
A community can have a lot of theoretical land capacity and still produce little housing if nobody can service the land. It can service land and still see little construction if project economics fail. It can improve project economics and still fail if builders, trades, materials, or finance are not available. It can permit more density and still get few units if the market cannot support the permitted form. It can secure funds and still meet long delays when approvals, design, infrastructure, procurement, or construction sequence become the constraint.
The first link that binds sets the output, but real systems seldom have one clean constraint. Two or three links can sit close to their limits at the same time. When that occurs, a fix to the tightest link adds very little, because the next link binds almost immediately. A council that removes a zoning barrier while servicing and construction cost are also near their limits can see no change in completions. The analysis must measure how much room each link has, as well as which link binds first.
This has an important result for policy. Upzoning helps when permitted density restricts projects that are otherwise viable. It has much less power when the real constraint is sewer capacity, development economics, finance, or construction capacity. A subsidy improves project economics, but it cannot create serviced land. Faster approvals shorten the process, but lenders still refuse a project that does not work. A municipal land contribution reduces land cost, but it cannot guarantee that contractors bid within the budget.
The practical task is to find the constraint that controls production now, and to find what occurs when it goes away. Fix servicing, and finance can become the constraint. Fix finance, and builder capacity can bind. Increase builder interest, and approvals can become the delay. The analysis must ask what prevents delivery today, and what will prevent it next.
Historical delivery is a base rate
When people compare historical production with a future target, two reactions are common. One is fatalism: the community built only 3.6 units a year, so it cannot build more. The other is to dismiss the historical rate because the future will be different. Both are inadequate.
Historical delivery is a base rate. It describes what the existing combination of land, infrastructure, rules, economics, finance, demand, approvals, and construction capacity actually produced. A forecast can depart from that base rate. The larger the departure, the more important it is to identify the mechanism that causes the change.
A move from 3.6 units a year to 5 can need only modest improvement. A move to about 14.5 needs something much larger, and the burden of proof must increase with the size of the assumed change.
For a change that large, the plan must answer specific questions. What new projects are in the pipeline? How many units sit on sites that someone can realistically develop, and which of those sites have services? What infrastructure investment has a firm commitment? What construction costs does the plan assume, and at what rents or sale prices do projects become viable? Who provides the equity and who provides the debt? Which public programs are necessary, how many local builders can do the work, and what approval and construction lead times apply?
For each condition, the plan must also say if it already exists, has funds, is only a proposal, or is still unknown. Until those answers exist, the gap between 3.6 and 14.5 is only an assumption.
The most dangerous capacity number can be technically correct
Land-capacity analysis has a similar problem. A parcel can physically hold more units. Zoning can permit them, so a plan counts them as capacity. All three statements can be true while the units stay very unlikely to appear.
It helps to separate five kinds of capacity. Theoretical capacity is what can fit under a set of planning assumptions. Permitted capacity is what current policy and zoning allow. Serviceable capacity is what infrastructure can support. Economic capacity is what builders can construct at costs and revenues that the market or funding model can sustain.
Deliverable capacity is what can realistically move through land assembly, design, finance, approval, procurement, construction, and occupancy in the decision period.
Plans often combine these into one number. That makes the system easier to describe and the decision harder to understand. A council needs to know how many units can theoretically exist, and it also needs to know what separates that number from the units that will probably appear.
Put the delivery chain beside the target
A housing target is much more useful for a decision when the council can follow every major assumption through the production system.
| Stage | What the decision-maker needs to know |
|---|---|
| Need | What population, household, affordability, or demographic basis produces the target? How current is it? |
| Demand | Who will occupy the units, with what tenure, and at what price? |
| Land | How much capacity is theoretical, permitted, serviceable, economically viable, and realistically available? |
| Policy | Which municipal rule or program will change delivery? |
| Servicing | Which water, sewer, road, utility, or site works are necessary? What do they cost, and when will they be complete? |
| Economics | What must be true about land, construction cost, rents, sale prices, subsidy, and operating cost for a project to start? |
| Finance | Who supplies capital, on what conditions, and what does not yet have funds? |
| Delivery market | Are builders, trades, consultants, materials, and procurement capacity available? |
| Approvals | Which decisions, permits, studies, and outside-agency approvals are on the critical path? |
| Production | What has actually received approval, started, finished, and found occupants? |
| Constraint | Which link limits additional output now, and how close is the next one? |
| Decision | Which council action actually reaches that constraint? |
The table earns its place because it changes the quality of the decision. A council can see if a plausible production mechanism supports the target. Staff can separate missing evidence from policy disagreement. A builder can identify the assumption that does not match the market, and a funder can see which condition depends on capital. Infrastructure staff can check if servicing plans already include the proposed growth. Where responsibility sits outside the municipality, the table shows that too.
The method works at any scale
Fruitvale is a small village, and its numbers are small. The method does not depend on size. A larger city has the same chain, with more actors on each link and a higher chance that several links bind at once.
Three things change with scale. The base rate comes from a longer record of completions, and it is more useful when you split it by housing form and by area. Permitted capacity can exceed annual production many times over, so the gap between permitted and deliverable capacity carries more of the analysis. The binding constraint can also differ by area: servicing in one district, land assembly in a second, construction cost in a third. The questions stay the same. What did the system produce, what does the target need, and which mechanism closes the gap?
What the target needs from the system
A council must not reject a housing target only because delivery is difficult. It must also not accept the target as a delivery forecast only because the need is real. These are two different propositions. The useful decision is to find what the target needs from the system, and whether those conditions exist.
Sometimes the result supports the target. Sometimes the target is correct in direction and the timing has no support. Sometimes an infrastructure decision must come before development. Sometimes zoning is not the binding constraint, or the missing evidence is construction economics. Sometimes the municipality finds that the key actor is a different organization.
That is the value of a trace through the chain. It turns a debate about a number into a diagnosis of delivery.
A target must come with a delivery thesis
The strongest housing plans explain why the system can produce the units they say the community needs. That explanation does not need certainty. Housing markets change too quickly, project pipelines are too uneven, and infrastructure timelines are too long for that. It needs an explicit argument, such as this one:
We expect this many units because these sites exist and these servicing conditions will hold. These policy changes affect the relevant constraint, and these projects can work economically. These actors have a reason and the capacity to deliver them. These indicators will tell us if the assumptions prove true.
Someone can test that argument, update it, and watch it fail. When it fails, decision-makers can see why. That is far more useful than a target that moves from needs assessment to policy, to budget, to public expectation, while the conditions for delivery stay hidden.
Need is a number. Delivery is a chain. A plan becomes credible when the number goes through the chain before it becomes a promise.
Trace your own chain
If your council has a housing target larger than its delivery record, send us the target and the last ten years of completions. We will trace the chain and show which link controls production. Talk to DDA
Sources
Regional District of Kootenay Boundary, Interim Housing Needs Report, February 2025. Source of the 20-year need of 291 units for Fruitvale.
Village of Fruitvale, land disposition RFP for 1800 Columbia Gardens Road, closed January 10, 2024. Source of the 2009 to 2019 construction record (36 units).
CitySpaces Consulting, Former Middle School Master Planning Project: Preliminary Background Report, prepared for the Village of Fruitvale, January 2020. Source of the vacancy figures (p. 9), the 2014 to 2018 new-home count (p. 9), and the builder statement on the $300,000 to $320,000 price point (p. 10).
Province of British Columbia, Housing Needs Reports. Background on the interim report requirement and the HNR Method.
Related thinking
The trade gap hidden inside a workforce number
The same problem occurs when a project workforce forecast becomes an assumption about labour supply, with no test against the chain that supplies workers.
When an unsupported number carries the answer
A method to separate sourced evidence, assumptions, derived figures, and missing inputs before they become part of a decision.